Introduction
Flooding, as a major natural disaster, affects many parts of the world including developed countries. Due to this natural disaster, billions of rupees in infrastructure and property damages and hundreds of human lives are lost each year. These hazards and losses can be prevented and reduced by providing reliable information to the public about the flood risk through flood inundation maps . Flood inundation maps are very essential for municipal planning, emergency action plans, flood insurance rates, and ecological studies.
Flood hazard assessment and mapping is used to identify areas at risk of flooding, and consequently to improve flood risk management and disaster preparedness. Flood Hazard Mapping is a vital component for appropriate land use planning in flood-prone areas. It creates easily-read, rapidly-accessible charts and maps which facilitate the identification of areas at risk of flooding and also helps prioritize mitigation and response efforts. Flood hazard assessments and maps typically look at the expected extent and depth of flooding in a given location, based on various scenarios.
Preparing digital elevation model
In order to create a Flood Hazard Map, With the help of Satellite Imagery, Drone survey, and Photogrammetry we can obtain the topographical data of the area of interest and process the data in GIS software and create a Digital Elevation Model created with the bare ground topographic surface of the Earth excluding trees, buildings, and any other surface objects. In which the Flood Inundation map-Chennai Highest and Lowest level of the site can be determined.

Simulation of flood flows of different return periods
Flood simulations will be conducted using hydrodynamic program for the floods of 10, 15, 50, and 100 return periods. This simulates the flow of water stream with one-dimensional steady flow, one and two-dimensional unsteady flow calculations, sediment transport/mobile bed computations for different return periods. Flood depths for each return period will be illustrated clearly in the maps. This program provides user to input data, data correction, to receive output display and analysis. HEC-RAS model needs details of river cross sections and upstream flow rate. The water depth and mean velocity are calculated for a given cross section using the energy conservation equation
Integrating DEM and Flood simulation
Through which the depth of the water shed for different category of floods can be determined. This maps helps us to understand the flood inundation in different location. In case of emergency these maps can be referred to different category of floods.
HEC-RAS calculates the water levels’ variation along the channel and the water level values are overlaid on a digital elevation model (DEM) of the area to get the extent and flood depth using GIS . Spatial data like cross section, river reach, stream network, flow paths, and others have been obtained using HEC-GeoRAS and these data then transferred to HEC-RAS
Conclusion
For the duration of an intense storm, real-time analysis includes using observed rainfall or gauged stage upstream as input for hydrology modeling, utilizing output flow rates to hydraulic modeling, and finally mapping the output (flood hazard mapping) by a GIS program. Then, this information is utilized to manage flood warning activities such as voidances and road closures. However, the stream velocities are usually too great during a flood to make the flood hazard mapping practical. For solving this problem, the flood hazard mapping procedures employed in this study may be utilized to prepare a series of flood hazard maps taking into account diverse return periods. In the duration of an intense storm, the flood warning controller can choose the most appropriate digital flood hazard map that corresponds most closely to the real-time measured stream flow.
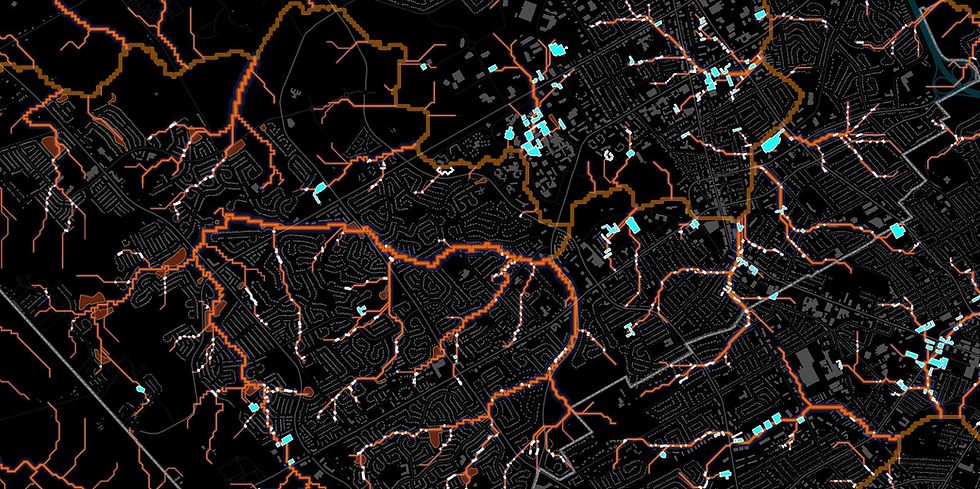
Flood Hazard Mapping Details:
Fill Sink, Flow Direction, Flow Length, Flow Accumulation, Pour Point, Watershed, Drainage System, Stream Order, Water System, Connecting Waterways.


Comments